Market Outlook
July11, 2017
Market Cues
Domestic Indices
Chg (%)
(Pts)
(Cl ose)
Indian markets are likely to open Positive on note tracking SGX Nifty and global
BSE Sensex
1.1
355
31,716
indices.
Nifty
1.1
103
9,769
The Nasdaq and the S&P 500 finished higher Monday as a pair embattled sectors,
Mid Cap
0.7
100
15,042
technology and energy, drew bidders, while the Dow industrials closed fractionally
Small Cap
0.4
168
15,899
lower. All the conversation right now are about earnings and Fed Chair yellen’s
Bankex
1.1
280
26,778
semiannual testimony before the house of Financial services committee on
Wednesday and before the senate banking committee on Thursday.
Global Indices
Chg (%)
(Pts)
(Cl ose)
The Dow edged down less than a tenth of a percent to 21,409, but the Nasdaq
climbed 0.4 percent to 6,176 and the S&P 500 inched up 0.1 percent to 2,427.
Dow Jones
(0.0)
1(6)
21,409
Nasdaq
0.4
23
6,176
U.K. stocks finished with gains Monday, as Schroders PLC and BAE Systems PLC
FTSE
0.3
19
7,370
outperformed among blue chips. The FTSE 100 index UKX, rose 0.3% to end at
Nikkei
(00.8
152
20,081
7,370., building on last week’s gain of 0.5%.
Hang Seng
0.6
159
25,500
On domestic front, initially trading was disrupted at NSE for about three hours due
Shanghai Com
(0.2)
(5)
3,213
to technical glitch. Indian shares rose sharply to close at fresh record highs on
Monday, with auto, telecom and technology stocks leading the surge on optimism
over corporate earnings. The BSE Sensex closed 1.13 percent higher at 31,716,
A dvances / Declines
BSE
NSE
crossing the 31,700 mark for the first time ever. The broader Nifty index closed at a
Advances
1,548
1,949
record high of 9,763, up 1.01 percent from its previous close.
Declines
1,147
674
Unchanged
137
60
News Analysis
SBI - Life Insurance Arm IPO
Detailed analysis is on Pg2
Volumes (` Cr)
BSE
9,919
Investor’s Ready Reckoner
NSE
25,980
Key Domestic & Global Indicators
Stock Watch: Latest investment recommendations on 150+ stocks
#Net Inflows (` Cr)
Ne t
Mtd
Ytd
Refer Pg6 onwards
FII
(56606
(1,324)
54,585
Top Picks
MFs
8232
1,579
40,725
C MP
Target
Upside
C ompany
Sector
R ating
(`)
(`)
(%)
Blue Star
Capital Goods
Buy
605
760
25.6
Top Gainers
Price (`)
Chg (%)
Dewan Housing FinanceFinancials
Buy
437
520
19.0
Divislab
734
7.9
Mahindra Lifespace
Real Estate
Buy
437
522
19.5
Rcom
24
7.3
Navkar Corporation
Others
Buy
206
265
29.0
Carerating
1,690
7.2
KEI Industrie s
Capital Goods
Accumulate
234
258
10.1
More Top Picks on Pg3
Pnb
153
6.3
Tataglobal
166
5.7
Key Upcoming Events
Previous
C onsensus
D ate
Region
Event Description
Reading
Expectations
Top Losers
Price (`)
Chg (%)
Jul 12, 2017
UK
Joble ss claims change
7.30
Religare
128
(10.2)
Jul12, 2017
US
Initial Jobless claims
248.00
245.00
Jul 13, 2017
India
Industrial Production YoY
3.10
Shriramcit
2,328
(6.4)
Jul 13, 2017
US
Producer Price Index (mom)
(0.70)
Idfc
57
(5.7)
Jul 13, 2017
India
Exports YoY%
8.30
Biocon
321
(4.7)
More Events on Pg4
Gdl
274
(3.7)
#as on 10t July, 2017
Market Outlook
July11, 2017
News Analysis
SBI to Sell Up To 8Cr Shares Of Life Insurance Arm Via IPO
The board of State Bank of India approved a proposal to sell up to 8Cr shares in
SBI Life Insurance's initial public offering.
As on March, SBI held 701 million shares or 70.1% in SBI Life, while the rest were
held by BNP Paribas Cardif (26%), private equity firm KKR (1.95%) and Singapore-
government-owned investment company Temasek (1.95%).
At the end of March 2016, SBI Life’s embedded value was at around Rs12,999Cr
according to a presentation by the company. According to current estimates by
bankers, this value has gone up by at least 17%, which means the embedded
value of SBI Life currently stands at around Rs15,200Cr.
SBI Life, the subsidiary of India's largest lender had earlier announced offloading
12 percent stake through the IPO. SBI Life will be only the second life insurer to list
since the government allowed foreign investors to increase stake in national
insurers to 49 percent from 26 percent earlier. ICICI Prudential Life Insurance was
the first to list in September 2016 after the norms were relaxed.
Economic and Political News
Tax dept gets busy on 15% hike in mop-up target
India raises import tax on sugar to 50%: Government statement
Government gives big fiscal stimulus in April-May 2017
Corporate News
Amtek Auto indefinitely postpones board meeting to consider Q1 results
Grasim divests entire stake in subsidiary
GSFC undertakes emergency shutdown of ammonia and urea plant due to
gas leakage
GMR Infrastructure: Secures funding worth Rs 1,330cr for Goa airport from
Axis Bank
Market Outlook
July11, 2017
Top Picks ★★★★★
Market Cap
C MP
Target
Upside
C ompany
R ationale
(` Cr)
(`)
(`)
(%)
Strong growth in domestic business due to its leadership
in acute therapeutic segme nt. Alke m expects to launch
Alkem Laboratories
21,988
1,839
2,161
17.5
more products in USA, which bodes for its international
busine ss.
We expect the company would report strong profitability
Asian Granito
1,372
456
480
5.3
owing to better product mix, hi gher B2C sales and
amalgamation synergy.
Favourable outl ook for the AC industry to augur well for
Cooling products business w hich i s out pacing the market
Blue Star
5,787
605
760
25.6
growth. EMPPAC divisi on's profitability to improve once
operating environme nt turns around.
With a focus on the low and me dium income (LMI)
consumer segment, the company has increased its
Dewan Housing Finance
13,702
437
520
19.0
presence i n tier-II & III cities where the growth opportunity
is immense .
Loan growth i s likely to pick up after a sluggish FY17.
Karur Vysya Bank
8,654
143
160
11.7
Lower credit cost will help in strong bottomline growth.
Increasing share of CASA will help in NIM i mprovement.
High order book execution in EPC segment, rising B2C
KEI Industrie s
1,824
234
258
10.1
sales and higher exports to boost the revenues and
profitability
Speedier execution and speedier sales, strong revenue
Mahindra Lifespace
2,242
437
522
19.5
visibilty in short-to-long run, attractive valuations
Massive capacity expansion al ong with rail advantage at
Navkar Corporation
2,931
206
265
29.0
ICD as well CFS augurs well for the company
Strong brands and distribution network would boost
Siyaram Silk Mills
2,105
2,245
2,500
11.3
growth going ahe ad. Stock currently trade s at an
inexpensive valuation.
Market leadership in Hindi news genre and no.
2
viewership ranking in English news genre, exit from the
TV Today Network
1,527
256
344
34.4
radio busine ss, and anticipated growth in ad spe nds by
corporates to benefit the stock.
After GST, the company is expected to see higher
volume s along with improving product mix. The Gujarat
Maruti
2,24,586
7,435
8,495
14.3
plant will also enable higher operating leverage which
will be margin accretive.
Source: Company, Angel Research,
Market Outlook
July11, 2017
Quarterly Bloomberg Brokers Consensus Estimate
IndusInd Bank Ltd - July 11, 2017
Particulars ( ` cr)
1QFY18E
1QFY17
y-o-y (%)
4QFY17
q-o-q (%)
PAT
834
661
26.0
752
10.9
Tata Consultancy Services Ltd Consol - July 13, 2017
Particulars ( ` cr)
1QFY18E
1QFY17
y-o-y (%)
4QFY17
q-o-q (%)
Net sales
29,579
29,305
0.9
29,642
(0.2)
EBITDA
7,726
7,838
(1.4)
8,132
(5.0)
EBITDA margin (%)
26.1
26.7
27.4
Net profit
6,200
6,317
(1.9)
6,608
(6.2)
Infosys Ltd Consol - July 14, 2017
Particulars ( ` cr)
1QFY18E
1QFY17
y-o-y (%)
4QFY17
q-o-q (%)
Net sales
16,998
16,782
1.3
17,120
(0.7)
EBITDA
4,463
4,447
0.3
4,658
(4.2)
EBITDA margin (%)
26.3
26.5
27.2
Net profit
3,429
3,436
(0.2)
3,603
(4.8)
ACC Ltd - July 17, 2017
Particulars ( ` cr)
2QCY17E
2QCY16
y-o-y (%)
1QCY17
q-o-q (%)
Net sales
3,263
2,870
13.7
3,557
(8.3)
EBITDA
454
457
(0.6)
416
9.1
EBITDA margin (%)
13.9
15.9
11.7
Net profit
246
238
3.5
212
16.4
Ultratech Cement Ltd - July 18, 2017
Particulars ( ` cr)
1QFY18E
1QFY17
y-o-y (%)
4QFY17
q-o-q (%)
Net sales
6,784
6,182
9.7
6,595
2.9
EBITDA
1,453
1,423
2.1
1,278
13.7
EBITDA margin (%)
21.4
23.0
19.4
Net profit
785
775
1.2
688
14.0
Market Outlook
July 11, 2017
Key Upcoming Events
Global economic events release calendar
Bl oomberg Data
D ate
Time
C ountry
Event Description
Unit
Period
L ast Reporte d
E stimate d
Jul 12, 2017
2:00 PM UK
Joble ss claims change
% Change
Jun
7.30
6:00 PM US
Initial Jobless claims
Thousands
Jul 8
248.00
245.00
Jul 13, 2017
5:30 PM India
Industrial Production YoY
% Change
May
3.10
US
Producer Price Index (mom)
% Change
Jun
(0.70)
India
Exports YoY%
% Change
Jun
8.30
Jul 14, 2017
China
Exports YoY%
% Change
Jun
8.70
9.00
India
Imports YoY%
% Change
Jun
33.10
6:45 PM US
Industrial Production
%
Jun
-
0.30
6:00 PM US
Consumer price index (mom)
% Change
Jun
(0.10)
0.10
12: 00 PM India
Monthly Wholesale Prices YoY%
% Change
Jun
2.17
Jul 17, 2017
7:30 AM China
Industrial Production (YoY)
% Change
Jun
6.50
6.50
7:30 AM China
Real GDP (YoY)
% Change
2Q
6.90
6.80
Jul 18, 2017
2:30 PM Euro Zone
Euro-Zone CPI (YoY)
%
Jun F
1.30
2:00 PM UK
CPI (YoY)
% Change
Jun
2.90
Jul 19, 2017
6:00 PM US
Housi ng Starts
Thousands
Jun
1,092.00
1,190.00
6:00 PM US
Building permits
Thousands
Jun
1,168.00
1,205.00
Jul 20, 2017
5:15 PM Euro Zone
ECB announces interest rates
%
Jul 20
-
7:30 PM Euro Zone
Euro-Zone Consumer Confidence
Value
Jul A
(1.30)
Jul 24, 2017
1:00 PM Germany
PMI Services
Value
Jul P
54.00
1:00 PM Germany
PMI Manufacturing
Value
Jul P
59.60
7:30 PM US
Existing home sales
Million
Jun
5.62
5.64
Source: Bloomberg, Angel Research
Market Outlook
July 11, 2017
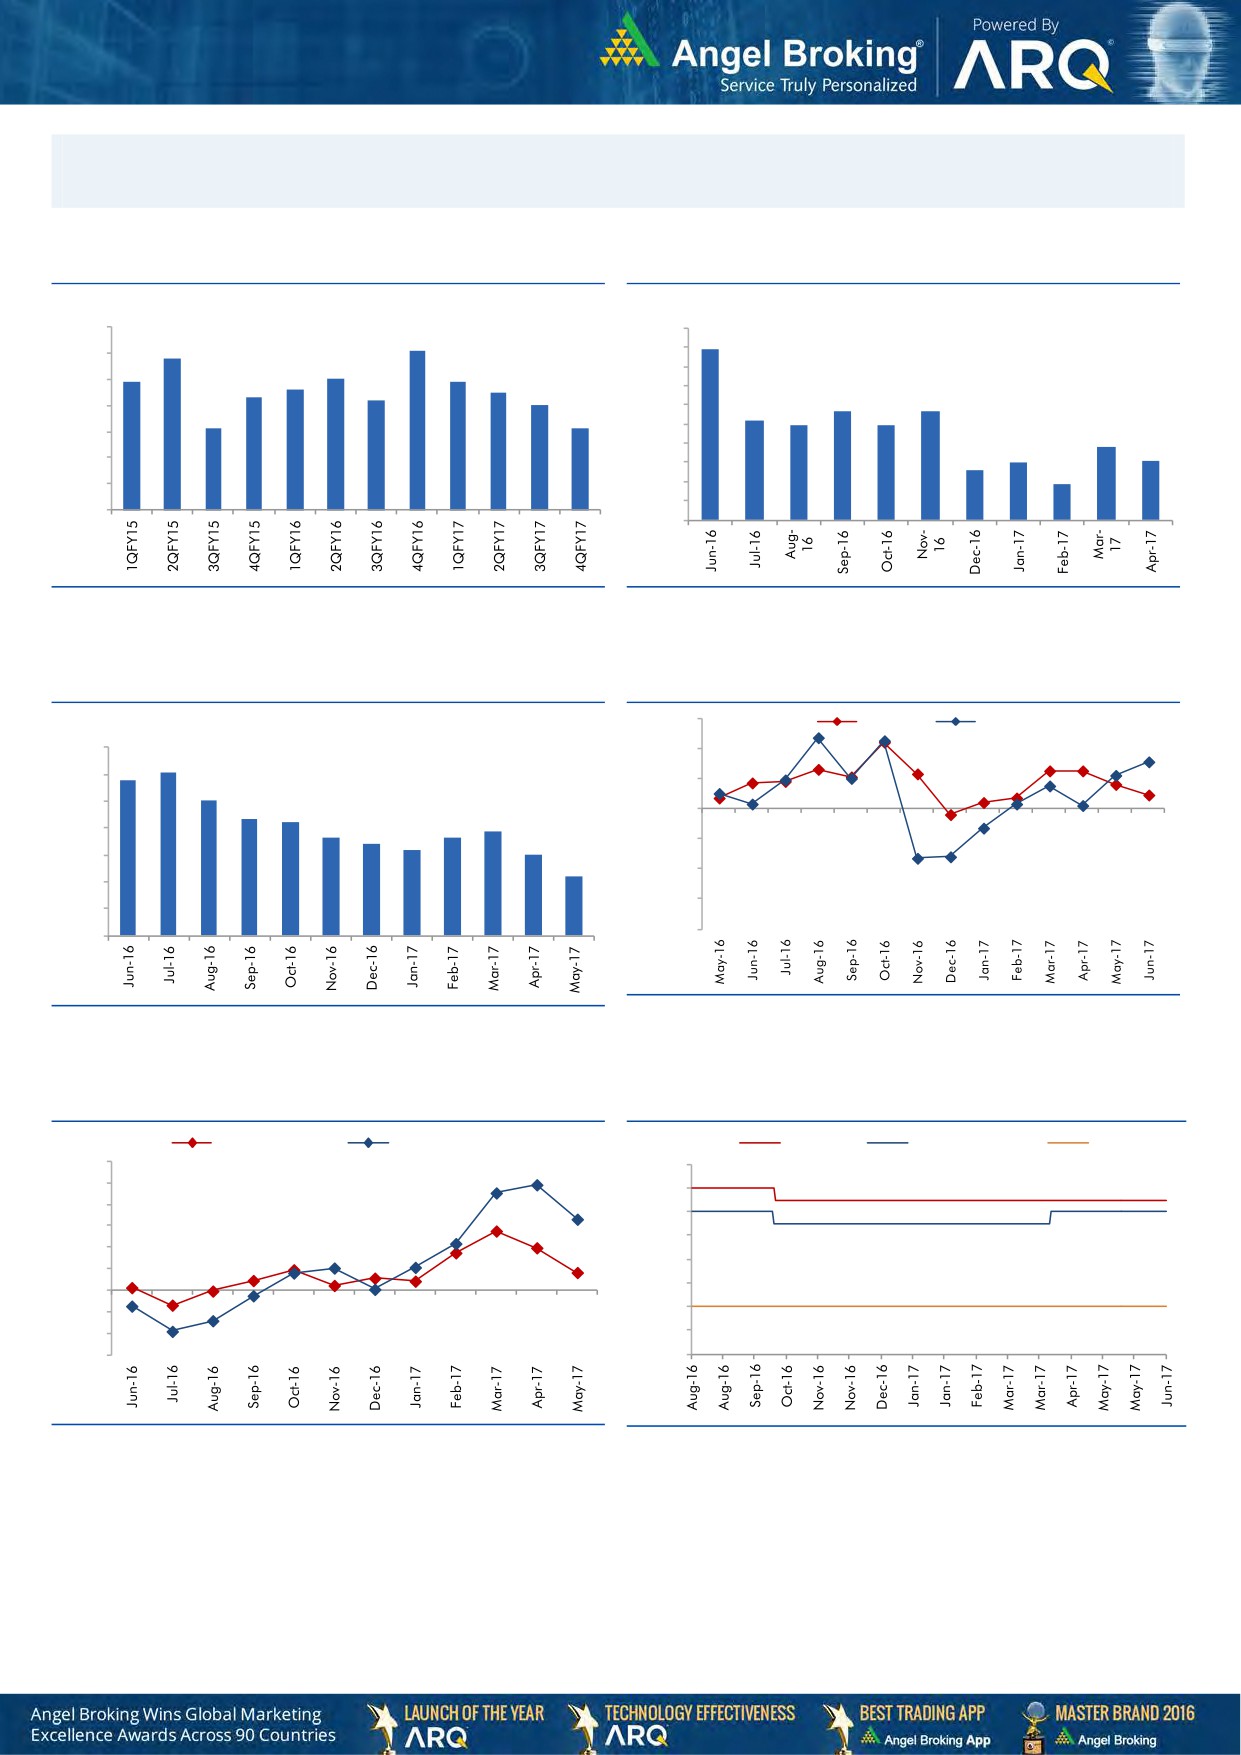
Macro watch
Exhibit 1: Quarterly GDP trends
Exhibit 2: IIP trends
(%)
(%)
10.0
10.0
9.1
8.9
8.8
9.0
9.0
7.9
8.0
7.9
8.0
7.6
7.5
8.0
7.3
7.2
7.0
7.0
5.7
5.7
7.0
6.0
5.2
6.1
6.1
4.9
4.9
5.0
6.0
3.8
4.0
3.0
3.1
5.0
2.6
3.0
1.9
4.0
2.0
1.0
3.0
-
Source: CSO, Angel Research
Source: MOSPI, Angel Research
Exhibit 3: Monthly CPI inflation trends
Exhibit 4: Manufacturing and services PMI
56.0
Mfg. PMI
Services PMI
(%)
7.0
54.0
6.1
5.8
6.0
52.0
5.1
5.0
4.3
4.2
3.9
50.0
3.6
3.7
4.0
3.4
3.2
3.0
48.0
3.0
2.2
46.0
2.0
44.0
1.0
42.0
-
Source: Market, Angel Research; Note: Level above 50 indicates expansion
Source: MOSPI, Angel Research
Exhibit 5: Exports and imports growth trends
Exhibit 6: Key policy rates
(%)
Exports yoy growth
Imports yoy growth
(%)
Repo rate
Reverse Repo rate
CRR
60.0
7.00
50.0
6.50
40.0
6.00
30.0
5.50
20.0
5.00
10.0
4.50
0.0
(10.0)
4.00
(20.0)
3.50
(30.0)
3.00
Source: Bloomberg, Angel Research
Source: RBI, Angel Research
Market Outlook
July 11, 2017
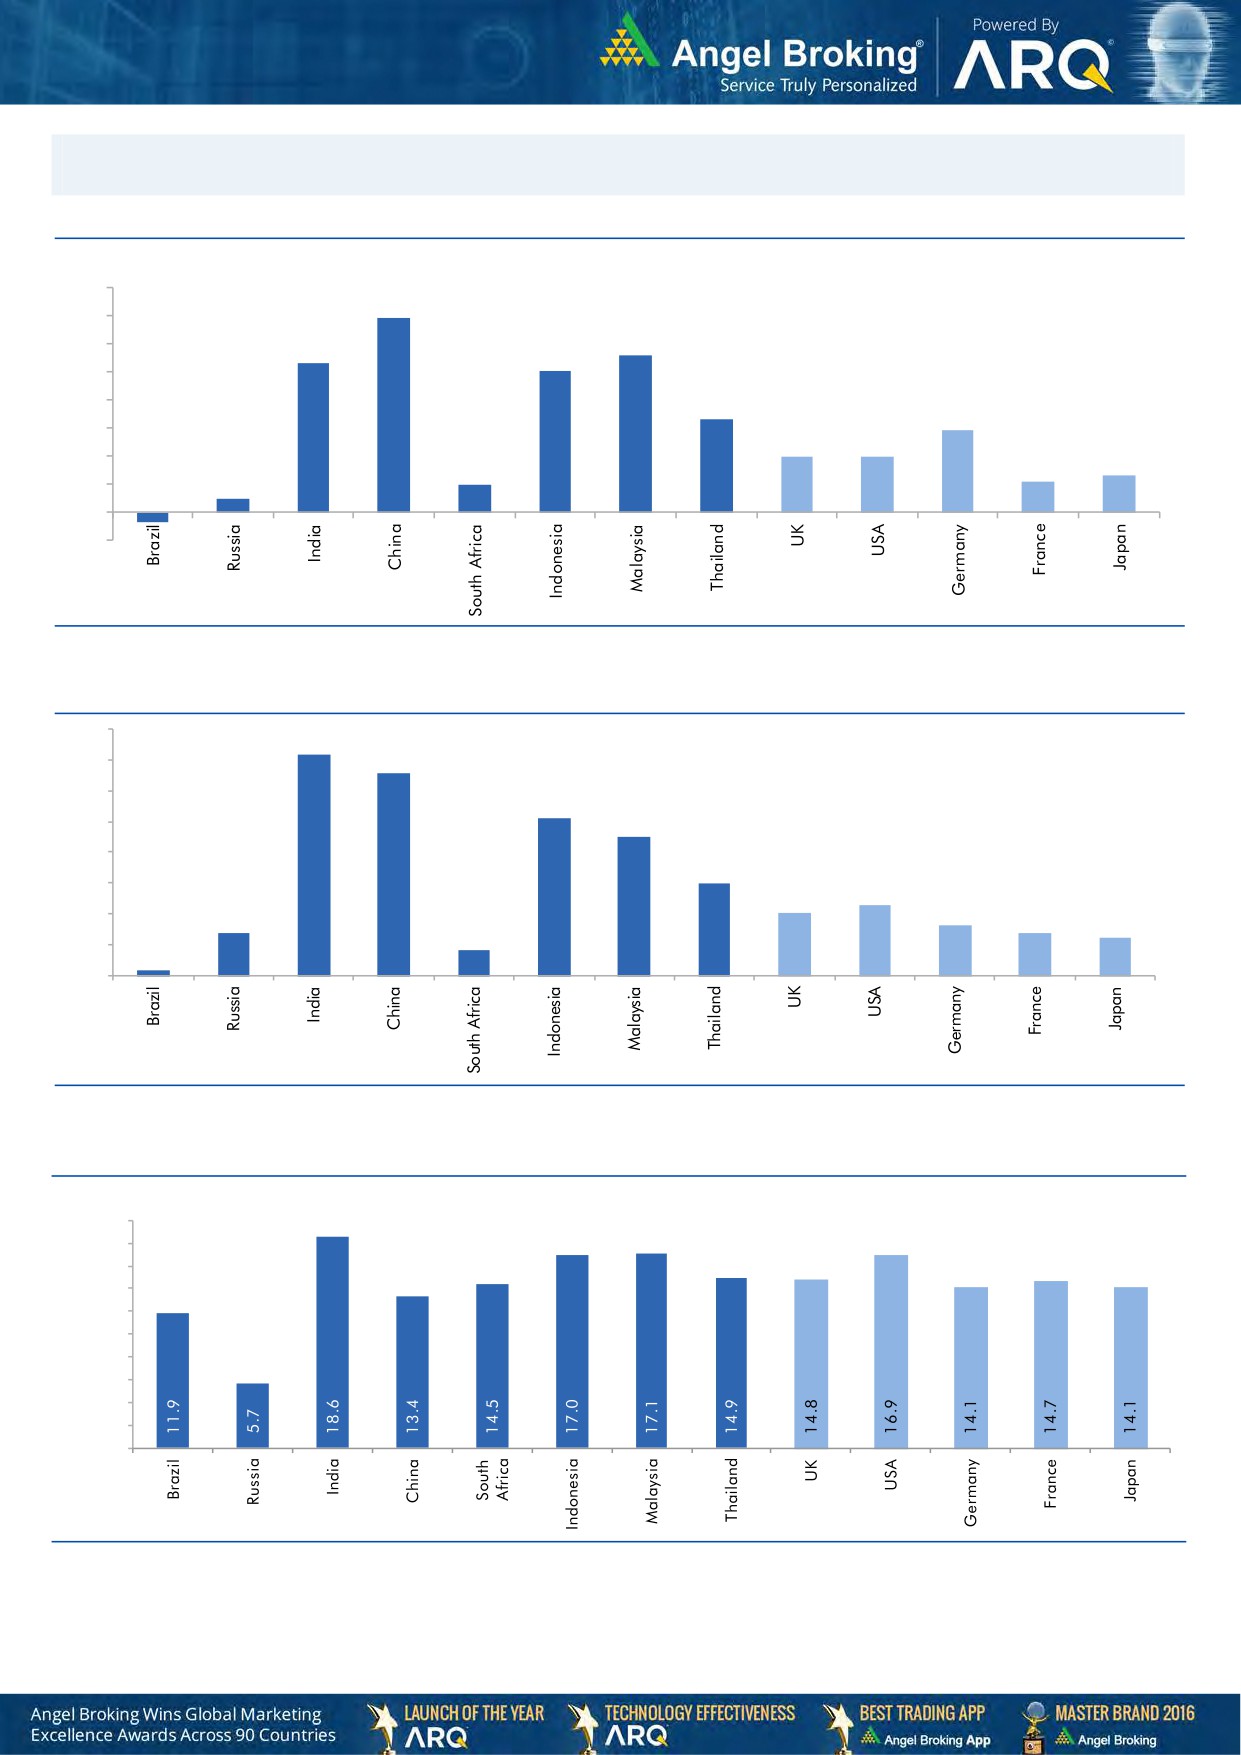
Global watch
Exhibit 1: Latest quarterly GDP Growth (%, yoy) across select developing and developed countries
(%)
8.0
6.9
7.0
5.6
6.0
5.3
5.0
1.0
5.0
4.0
3.3
2.9
3.0
2.0
2.0
0.5
2.0
1.1
1.3
1.0
-
(1.0)
(0.4)
Source: Bloomberg, Angel Research
Exhibit 2: 2016 GDP Growth projection by IMF (%, yoy) across select developing and developed countries
(%)
7.2
7.0
6.6
6.0
5.1
5.0
4.5
4.0
3.0
3.0
2.3
2.0
1.4
1.6
2.0
1.4
1.2
0.2
0.8
1.0
-
Source: IMF, Angel Research
Exhibit 3: One year forward P-E ratio across select developing and developed countries
(x)
20.0
18.0
16.0
14.0
12.0
10.0
8.0
6.0
4.0
2.0
-
Source: IMF, Angel Research
Market Outlook
July 11, 2017
Exhibit 4: Relative performance of indices across globe
Returns (%)
C ountry
Name of index
Closing price
1M
3M
1YR
Brazil
Bovespa
63,025
(1.0)
(5.2)
20.2
Russia
Micex
1,926
2.6
(6.8)
(1.1)
9,771
1.1
5.5
16.7
India
Nifty
3,213
2.0
(2.1)
10.3
China
Shanghai Composite
45,977
(0.3)
(0.2)
2.6
South Africa
Top 40
50,617
1.6
1.7
9.4
Mexico
Mexbol
967
1.9
5.0
17.3
Indonesia
LQ45
1,757
(1.7)
0.6
7.0
Malaysia
KLCI
Thailand
SET 50
993
0.5
(0.7)
9.0
21,409
1.3
3.7
18.0
USA
Dow Jones
7,370
(1.1)
0.5
10.3
UK
FTSE
20,081
0.9
8.0
28.0
Japan
Nikkei
12,446
(2.0)
1.9
23.7
Germany
DAX
5,166
(2.0)
0.8
18.4
France
CAC
Source: Bloomberg, Angel Research,
Stock Watch
July 11, 2017
Company Name
Reco
CMP
Target
Mkt Cap
Sales ( Čcr )
OPM(%)
EPS (Č)
PER(x)
P/BV(x)
RoE(%)
EV/Sales(x)
(Č)
Price ( Č)
( Č cr )
FY17E FY18E
FY17E
FY18E
FY17E
FY18E
FY17E
FY18E
FY17E
FY18E
FY17E
FY18E
FY17E
FY18E
Agri / Agri Chemical
Rallis
Reduce
244
209
4,743
1,937
2,164
13.3
14.3
9.0
11.0
27.1
22.2
4.7
4.1
18.4
19.8
2.5
2.2
United Phosphorus
Neutral
851
-
43,244
15,176
17,604
18.5
18.5
37.4
44.6
22.8
19.1
4.5
3.7
21.4
21.2
3.0
2.5
Auto & Auto Ancillary
Ashok Leyland
Accumulate
105
116
30,816
20,019
22,789
11.1
11.7
4.3
5.5
24.5
19.3
4.8
4.3
19.4
22.0
1.5
1.3
Bajaj Auto
Neutral
2,730
-
78,983
25,093
27,891
19.5
19.2
143.9
162.5
19.0
16.8
5.3
4.6
30.3
29.4
2.9
2.5
Bharat Forge
Neutral
1,122
-
26,110
7,726
8,713
20.5
21.2
35.3
42.7
31.8
26.3
5.9
5.3
18.9
20.1
3.4
3.0
Eicher Motors
Neutral
27,929
-
76,028
16,583
20,447
17.5
18.0
598.0
745.2
46.7
37.5
16.0
12.2
41.2
38.3
4.4
3.5
Gabriel India
Neutral
150
-
2,154
1,544
1,715
9.0
9.3
5.4
6.3
27.8
23.8
5.2
4.6
18.9
19.5
1.4
1.2
Hero Motocorp
Neutral
3,733
-
74,542
28,120
30,753
15.2
15.6
169.1
189.2
22.1
19.7
7.6
6.4
30.8
28.2
2.5
2.2
Jamna Auto Industries Neutral
261
-
2,077
1,486
1,620
9.8
9.9
15.0
17.2
17.4
15.2
3.8
3.2
21.8
21.3
1.5
1.3
L G Balakrishnan & Bros Neutral
780
-
1,224
1,302
1,432
11.6
11.9
43.7
53.0
17.9
14.7
2.5
2.3
13.8
14.2
1.0
0.9
Mahindra and Mahindra Neutral
1,368
-
84,947
46,534
53,077
11.6
11.7
67.3
78.1
20.3
17.5
3.3
2.9
15.4
15.8
1.8
1.5
Maruti
Accumulate
7,435
8,495
224,586
67,822
83,717
15.2
15.0
243.0
291.5
30.6
25.5
7.0
5.7
22.9
22.4
3.0
2.4
Minda Industries
Neutral
671
-
5,800
2,728
3,042
9.0
9.1
68.2
86.2
9.8
7.8
2.2
1.8
23.8
24.3
2.2
1.9
Motherson Sumi
Neutral
311
-
65,490
45,896
53,687
7.8
8.3
13.0
16.1
23.9
19.3
7.7
6.1
34.7
35.4
1.5
1.3
Rane Brake Lining
Neutral
1,328
-
1,051
511
562
11.3
11.5
28.1
30.9
47.3
43.0
7.2
6.6
15.3
15.0
2.2
2.0
Setco Automotive
Neutral
42
-
566
741
837
13.0
13.0
15.2
17.0
2.8
2.5
0.5
0.4
15.8
16.3
1.2
1.0
Tata Motors
Neutral
447
-
128,992
300,209
338,549
8.9
8.4
42.7
54.3
10.5
8.2
1.7
1.4
15.6
17.2
0.5
0.5
TVS Motor
Neutral
569
-
27,054
13,390
15,948
6.9
7.1
12.8
16.5
44.6
34.4
11.1
8.8
26.3
27.2
2.1
1.7
Amara Raja Batteries
Accumulate
866
962
14,796
5,339
6,220
15.9
15.3
28.0
32.3
30.9
26.8
5.9
5.0
19.1
18.5
2.8
2.4
Exide Industries
Neutral
229
-
19,482
7,439
8,307
15.0
15.0
8.1
9.3
28.3
24.7
4.0
3.5
14.3
16.7
2.2
2.0
Apollo Tyres
Neutral
257
-
13,097
12,877
14,504
14.3
13.9
21.4
23.0
12.0
11.2
1.9
1.6
16.4
15.2
1.2
1.1
Ceat
Neutral
1,882
-
7,611
7,524
8,624
13.0
12.7
131.1
144.3
14.4
13.0
2.6
2.2
19.8
18.6
1.1
1.0
JK Tyres
Neutral
169
-
3,825
7,455
8,056
15.0
15.0
21.8
24.5
7.7
6.9
1.6
1.3
22.8
21.3
0.6
0.5
Swaraj Engines
Neutral
2,260
-
2,807
660
810
15.2
16.4
54.5
72.8
41.5
31.1
12.9
11.7
31.5
39.2
4.1
3.3
Subros
Neutral
254
-
1,524
1,488
1,681
11.7
11.9
6.4
7.2
39.7
35.4
4.2
3.8
10.8
11.4
1.3
1.1
Indag Rubber
Neutral
211
-
554
286
326
19.8
16.8
11.7
13.3
18.1
15.8
3.1
2.9
17.8
17.1
1.6
1.4
Capital Goods
ACE
Neutral
73
-
720
709
814
4.1
4.6
1.4
2.1
52.0
34.7
2.1
2.0
4.4
6.0
1.2
1.0
BEML
Neutral
1,570
-
6,538
3,451
4,055
6.3
9.2
31.4
57.9
50.0
27.1
3.0
2.7
6.3
10.9
2.0
1.7
Bharat Electronics
Neutral
173
-
38,575
8,137
9,169
16.8
17.2
58.7
62.5
2.9
2.8
0.5
0.4
44.6
46.3
3.7
3.3
Stock Watch
July 11, 2017
Company Name
Reco
CMP
Target
Mkt Cap
Sales ( Čcr )
OPM(%)
EPS (Č)
PER(x)
P/BV(x)
RoE(%)
EV/Sales(x)
(Č)
Price ( Č)
( Č cr )
FY17E
FY18E
FY17E
FY18E
FY17E
FY18E
FY17E
FY18E
FY17E
FY18E
FY17E
FY18E
FY17E
FY18E
Capital Goods
Voltas
Neutral
467
-
15,446
6,511
7,514
7.9
8.7
12.9
16.3
36.2
28.6
6.5
5.7
16.7
18.5
2.1
1.8
BGR Energy
Neutral
154
-
1,110
16,567
33,848
6.0
5.6
7.8
5.9
19.7
26.1
1.1
1.1
4.7
4.2
0.2
0.1
BHEL
Neutral
137
-
33,630
28,797
34,742
-
2.8
2.3
6.9
59.7
19.9
1.0
1.0
1.3
4.8
0.8
0.6
Blue Star
Buy
605
760
5,787
4,283
5,077
5.9
7.3
14.9
22.1
40.6
27.3
7.9
6.7
20.4
26.4
1.4
1.2
CG Power and Industrial
Neutral
83
-
5,205
5,777
6,120
5.9
7.0
3.3
4.5
25.2
18.5
1.1
1.1
4.4
5.9
0.9
0.7
Solutions
Greaves Cotton
Neutral
161
-
3,938
1,755
1,881
16.8
16.9
7.8
8.5
20.7
19.0
4.1
3.8
20.6
20.9
1.9
1.8
Inox Wind
Neutral
146
-
3,250
5,605
6,267
15.7
16.4
24.8
30.0
5.9
4.9
1.7
1.2
25.9
24.4
0.6
0.5
KEC International
Neutral
271
-
6,979
9,294
10,186
7.9
8.1
9.9
11.9
27.4
22.8
4.0
3.5
15.6
16.3
1.0
0.9
KEI Industries
Accumulate
234
258
1,824
2,633
3,001
10.4
10.0
12.7
13.0
18.4
18.0
3.9
3.3
21.4
18.2
0.9
0.8
Thermax
Neutral
921
-
10,974
5,421
5,940
7.3
7.3
25.7
30.2
35.8
30.5
4.3
4.0
12.2
13.1
1.9
1.7
VATech Wabag
Neutral
666
-
3,636
3,136
3,845
8.9
9.1
26.0
35.9
25.6
18.6
3.2
2.7
13.4
15.9
1.1
0.8
Cement
ACC
Neutral
1,628
-
30,567
11,225
13,172
13.2
16.9
44.5
75.5
36.6
21.6
3.5
3.2
11.2
14.2
2.7
2.3
Ambuja Cements
Neutral
255
-
50,545
9,350
10,979
18.2
22.5
5.8
9.5
43.9
26.8
3.7
3.3
10.2
12.5
5.4
4.6
India Cements
Neutral
205
-
6,317
4,364
4,997
18.5
19.2
7.9
11.3
26.0
18.1
1.9
1.8
8.0
8.5
2.2
1.9
JK Cement
Neutral
973
-
6,803
4,398
5,173
15.5
17.5
31.2
55.5
31.2
17.5
3.7
3.2
12.0
15.5
2.1
1.7
J K Lakshmi Cement
Neutral
470
-
5,533
2,913
3,412
14.5
19.5
7.5
22.5
62.7
20.9
3.9
3.2
12.5
18.0
2.5
2.1
Orient Cement
Neutral
156
-
3,198
2,114
2,558
18.5
20.5
8.1
11.3
19.3
13.8
2.8
2.4
9.0
14.0
2.1
1.7
UltraTech Cement
Neutral
4,144
-
113,762
25,768
30,385
21.0
23.5
111.0
160.0
37.3
25.9
4.8
4.2
13.5
15.8
4.5
3.8
Construction
ITNL
Neutral
99
-
3,265
8,946
10,017
31.0
31.6
8.1
9.1
12.3
10.9
0.5
0.5
4.2
5.0
3.7
3.4
KNR Constructions
Neutral
214
-
3,004
1,385
1,673
14.7
14.0
41.2
48.5
5.2
4.4
1.0
0.8
14.9
15.2
2.2
1.9
Larsen & Toubro
Neutral
1,732
-
161,686
111,017
124,908
11.0
11.0
61.1
66.7
28.4
26.0
3.4
3.2
13.1
12.9
2.5
2.3
Gujarat Pipavav Port
Neutral
151
-
7,285
705
788
52.2
51.7
5.0
5.6
30.1
26.9
3.0
2.7
11.2
11.2
10.0
8.4
Nagarjuna Const.
Neutral
90
-
5,020
8,842
9,775
9.1
8.8
5.3
6.4
17.0
14.1
1.4
1.2
8.2
9.1
0.7
0.6
PNC Infratech
Neutral
149
-
3,815
2,350
2,904
13.1
13.2
9.0
8.8
16.5
16.9
0.6
0.5
15.9
13.9
1.7
1.4
Simplex Infra
Neutral
537
-
2,656
6,829
7,954
10.5
10.5
31.4
37.4
17.1
14.4
1.8
1.6
9.9
13.4
0.8
0.7
Power Mech Projects
Neutral
588
-
864
1,801
2,219
12.7
14.6
72.1
113.9
8.2
5.2
1.5
1.3
16.8
11.9
0.5
0.4
Sadbhav Engineering
Neutral
295
-
5,069
3,598
4,140
10.3
10.6
9.0
11.9
32.8
24.8
3.4
3.0
9.9
11.9
1.7
1.4
NBCC
Neutral
206
-
18,495
7,428
9,549
7.9
8.6
8.2
11.0
25.1
18.7
1.3
1.0
28.2
28.7
2.2
1.7
MEP Infra
Neutral
140
-
2,271
1,877
1,943
30.6
29.8
3.0
4.2
46.6
33.3
22.5
15.2
0.6
0.6
2.6
2.4
Stock Watch
July 11, 2017
Company Name
Reco
CMP
Target
Mkt Cap
Sales ( Čcr )
OPM(%)
EPS (Č)
PER(x)
P/BV(x)
RoE(%)
EV/Sales(x)
(Č)
Price ( Č)
( Č cr )
FY17E
FY18E
FY17E
FY18E
FY17E
FY18E
FY17E
FY18E
FY17E
FY18E
FY17E
FY18E
FY17E
FY18E
Construction
SIPL
Neutral
108
-
3,804
1,036
1,252
65.5
66.2
(8.4)
(5.6)
4.0
4.6
(22.8)
(15.9)
11.9
9.9
Engineers India
Neutral
157
-
10,563
1,725
1,935
16.0
19.1
11.4
13.9
13.8
11.3
1.9
1.8
13.4
15.3
5.1
4.5
Financials
Axis Bank
Accumulate
510
580
122,188
46,932
53,575
3.5
3.4
32.4
44.6
15.8
11.4
2.0
1.8
13.6
16.5
-
-
Bank of Baroda
Neutral
167
-
38,422
19,980
23,178
1.8
1.8
11.5
17.3
14.5
9.6
1.7
1.4
8.3
10.1
-
-
Canara Bank
Neutral
361
-
21,583
15,225
16,836
1.8
1.8
14.5
28.0
24.9
12.9
1.7
1.4
5.8
8.5
-
-
Can Fin Homes
Neutral
3,235
-
8,612
420
526
3.5
3.5
86.5
107.8
37.4
30.0
8.1
6.6
23.6
24.1
-
-
Cholamandalam Inv. &
Accumulate
1,125
1,230
17,585
2,012
2,317
6.3
6.3
42.7
53.6
26.4
21.0
4.2
3.6
16.9
18.3
-
-
Fin. Co.
Dewan Housing Finance Buy
437
520
13,702
2,225
2,688
2.9
2.9
29.7
34.6
14.7
12.6
2.4
1.6
16.1
14.8
-
-
Equitas Holdings
Buy
160
235
5,412
939
1,281
11.7
11.5
5.8
8.2
27.6
19.5
2.4
2.1
10.9
11.5
-
-
Federal Bank
Accumulate
114
125
22,198
8,259
8,995
3.0
3.0
4.3
5.6
26.6
20.4
2.3
2.1
8.5
10.1
-
-
HDFC
Neutral
1,638
-
260,940
11,475
13,450
3.4
3.4
45.3
52.5
36.2
31.2
7.0
6.2
20.2
20.5
-
-
HDFC Bank
Neutral
1,677
-
431,537
46,097
55,433
4.5
4.5
58.4
68.0
28.7
24.7
5.0
4.2
18.8
18.6
-
-
ICICI Bank
Accumulate
292
315
186,934
42,800
44,686
3.1
3.3
18.0
21.9
16.2
13.3
2.2
2.0
11.1
12.3
-
-
Karur Vysya Bank
Accumulate
143
160
8,654
5,640
6,030
3.3
3.2
8.9
10.0
16.1
14.3
1.7
1.6
11.2
11.4
-
-
Lakshmi Vilas Bank
Neutral
204
-
3,913
3,339
3,799
2.7
2.8
11.0
14.0
18.6
14.6
1.9
1.8
11.2
12.7
-
-
LIC Housing Finance
Neutral
743
-
37,504
3,712
4,293
2.6
2.5
39.0
46.0
19.1
16.2
3.6
3.1
19.9
20.1
-
-
Punjab Natl.Bank
Neutral
153
-
32,611
23,532
23,595
2.3
2.4
6.8
12.6
22.5
12.2
3.5
2.5
3.3
6.5
-
-
RBL Bank
Neutral
533
-
20,059
1,783
2,309
2.6
2.6
12.7
16.4
41.9
32.5
4.6
4.1
12.8
13.3
-
-
Repco Home Finance
Neutral
802
-
5,017
388
457
4.5
4.2
30.0
38.0
26.7
21.1
4.5
3.7
18.0
19.2
-
-
South Ind.Bank
Neutral
29
-
5,194
6,435
7,578
2.5
2.5
2.7
3.1
10.7
9.3
1.4
1.2
10.1
11.2
-
-
St Bk of India
Neutral
286
-
246,488
88,650
98,335
2.6
2.6
13.5
18.8
21.2
15.2
2.0
1.8
7.0
8.5
-
-
Union Bank
Neutral
157
-
10,769
13,450
14,925
2.3
2.3
25.5
34.5
6.1
4.5
0.9
0.8
7.5
10.2
-
-
Yes Bank
Neutral
1,513
-
69,193
8,978
11,281
3.3
3.4
74.0
90.0
20.4
16.8
3.9
3.3
17.0
17.2
-
-
FMCG
Akzo Nobel India
Neutral
1,830
-
8,777
2,955
3,309
13.3
13.7
57.2
69.3
32.0
26.4
10.5
8.8
32.7
33.3
2.8
2.4
Asian Paints
Neutral
1,131
-
108,457
17,128
18,978
16.8
16.4
19.1
20.7
59.2
54.6
20.6
19.4
34.8
35.5
6.3
5.6
Britannia
Neutral
3,712
-
44,568
9,594
11,011
14.6
14.9
80.3
94.0
46.2
39.5
19.0
14.7
41.2
-
4.5
3.9
Colgate
Neutral
1,093
-
29,727
4,605
5,149
23.4
23.4
23.8
26.9
45.9
40.6
25.4
19.9
64.8
66.8
6.4
5.7
Dabur India
Neutral
304
-
53,568
8,315
9,405
19.8
20.7
8.1
9.2
37.5
33.1
10.5
8.7
31.6
31.0
6.1
5.4
GlaxoSmith Con*
Neutral
5,470
-
23,006
4,350
4,823
21.2
21.4
179.2
196.5
30.5
27.9
8.1
6.9
27.1
26.8
4.7
4.1
Stock Watch
July 11, 2017
Company Name
Reco
CMP
Target
Mkt Cap
Sales ( Čcr )
OPM(%)
EPS (Č)
PER(x)
P/BV(x)
RoE(%)
EV/Sales(x)
(Č)
Price ( Č)
( Č cr )
FY17E FY18E
FY17E
FY18E
FY17E
FY18E
FY17E
FY18E
FY17E
FY18E
FY17E
FY18E
FY17E
FY18E
FMCG
Godrej Consumer
Neutral
976
-
66,502
10,235
11,428
18.4
18.6
41.1
44.2
23.8
22.1
5.3
4.5
24.9
24.8
6.6
5.8
HUL
Neutral
1,097
-
237,388
35,252
38,495
17.8
17.8
20.7
22.4
53.1
49.0
50.8
43.5
95.6
88.9
6.6
6.0
ITC
Neutral
333
-
404,971
40,059
44,439
38.3
39.2
9.0
10.1
37.1
32.9
10.4
9.0
27.8
27.5
9.6
8.7
Marico
Neutral
324
-
41,773
6,430
7,349
18.8
19.5
6.4
7.7
50.6
42.0
15.3
12.9
33.2
32.5
6.3
5.5
Nestle*
Neutral
6,809
-
65,650
10,073
11,807
20.7
21.5
124.8
154.2
54.6
44.2
22.4
20.2
34.8
36.7
6.3
5.4
Tata Global
Neutral
166
-
10,505
8,675
9,088
9.8
9.8
7.4
8.2
22.5
20.3
1.8
1.7
7.9
8.1
1.1
1.1
Procter & Gamble
Neutral
8,050
-
26,131
2,939
3,342
23.2
23.0
146.2
163.7
55.1
49.2
13.9
11.6
25.3
23.5
8.4
7.3
Hygiene
IT
HCL Tech^
Buy
851
1,014
121,387
46,723
52,342
22.1
20.9
60.0
62.8
14.2
13.6
3.6
3.0
25.3
22.4
2.3
2.0
Infosys
Buy
959
1,179
220,289
68,484
73,963
26.0
26.0
63.0
64.0
15.2
15.0
3.2
2.9
20.8
19.7
2.9
2.5
TCS
Accumulate
2,441
2,651
480,952
117,966
127,403
27.5
27.6
134.3
144.5
18.2
16.9
5.4
5.0
29.8
29.7
3.7
3.5
Tech Mahindra
Buy
385
533
37,555
29,141
31,051
14.4
15.0
32.3
35.6
11.9
10.8
2.0
1.8
17.1
17.0
1.1
1.0
Wipro
Neutral
269
-
130,656
55,421
58,536
20.3
20.3
35.1
36.5
7.7
7.4
1.3
1.1
19.2
14.6
1.8
1.5
Media
D B Corp
Neutral
381
-
7,004
2,297
2,590
27.4
28.2
21.0
23.4
18.1
16.3
4.2
3.7
23.7
23.1
2.9
2.5
HT Media
Neutral
82
-
1,904
2,693
2,991
12.6
12.9
7.9
9.0
10.4
9.1
0.9
0.8
7.8
8.3
0.3
0.2
Jagran Prakashan
Buy
177
225
5,801
2,283
2,555
28.0
28.0
10.6
12.3
16.7
14.5
3.6
3.1
21.4
21.4
2.6
2.2
Sun TV Network
Neutral
830
-
32,689
2,850
3,265
70.1
71.0
26.2
30.4
31.7
27.3
8.1
7.2
24.3
25.6
11.1
9.5
Hindustan Media
Neutral
276
-
2,026
1,016
1,138
24.3
25.2
27.3
30.1
10.1
9.2
1.9
1.7
16.2
15.8
1.3
1.1
Ventures
TV Today Network
Buy
256
344
1,527
608
667
21.5
22.3
15.7
19.2
16.3
13.3
2.5
2.1
16.1
16.0
2.1
1.8
Metals & Mining
Coal India
Neutral
259
-
160,896
84,638
94,297
21.4
22.3
24.5
27.1
10.6
9.6
4.4
4.2
42.6
46.0
1.4
1.3
Hind. Zinc
Neutral
268
-
113,154
14,252
18,465
55.9
48.3
15.8
21.5
17.0
12.5
2.8
2.4
17.0
20.7
7.9
6.1
Hindalco
Neutral
196
-
43,926
107,899
112,095
7.4
8.2
9.2
13.0
21.3
15.1
1.0
1.0
4.8
6.6
0.9
0.9
JSW Steel
Neutral
218
-
52,792
53,201
58,779
16.1
16.2
130.6
153.7
1.7
1.4
0.2
0.2
14.0
14.4
1.8
1.5
NMDC
Neutral
118
-
37,207
6,643
7,284
44.4
47.7
7.1
7.7
16.6
15.3
1.4
1.4
8.8
9.2
3.4
3.0
SAIL
Neutral
63
-
26,020
47,528
53,738
(0.7)
2.1
(1.9)
2.6
24.2
0.7
0.7
(1.6)
3.9
1.4
1.3
Vedanta
Neutral
261
-
96,907
71,744
81,944
19.2
21.7
13.4
20.1
19.5
13.0
1.7
1.5
8.4
11.3
1.7
1.4
Tata Steel
Neutral
559
-
54,310
121,374
121,856
7.2
8.4
18.6
34.3
30.1
16.3
1.9
1.7
6.1
10.1
1.1
1.1
Oil & Gas
GAIL
Neutral
367
-
62,113
56,220
65,198
9.3
10.1
27.1
33.3
13.6
11.0
1.2
1.2
9.3
10.7
1.3
1.1
ONGC
Neutral
163
-
208,925
137,222
152,563
15.0
21.8
19.5
24.1
8.4
6.8
0.7
0.7
8.5
10.1
1.8
1.6
Indian Oil Corp
Neutral
383
-
185,787
373,359
428,656
5.9
5.5
54.0
59.3
7.1
6.5
1.1
1.0
16.0
15.6
0.7
0.6
Stock Watch
July 11, 2017
Company Name
Reco
CMP
Target
Mkt Cap
Sales ( Čcr )
OPM(%)
EPS (Č)
PER(x)
P/BV(x)
RoE(%)
EV/Sales(x)
(Č)
Price ( Č)
( Č cr )
FY17E FY18E
FY17E
FY18E
FY17E
FY18E
FY17E
FY18E
FY17E
FY18E
FY17E
FY18E
FY17E
FY18E
Oil & Gas
Reliance Industries
Neutral
1,492
-
485,280
301,963
358,039
12.1
12.6
87.7
101.7
17.0
14.7
1.7
1.6
10.7
11.3
2.1
1.7
Pharmaceuticals
Alembic Pharma
Buy
516
648
9,729
3,101
3,966
19.7
20.5
21.4
25.5
24.1
20.2
5.1
4.2
23.0
22.8
3.1
2.3
Alkem Laboratories Ltd
Buy
1,839
2,161
21,988
5,853
6,901
17.1
18.4
74.6
85.0
24.6
21.6
5.2
4.4
21.1
20.2
3.7
3.2
Aurobindo Pharma
Buy
710
823
41,592
14,845
17,086
21.5
22.1
39.4
44.7
18.0
15.9
4.4
3.5
27.6
24.7
3.0
2.5
Aventis*
Neutral
4,251
-
9,790
2,206
2,508
16.6
16.8
128.9
139.9
33.0
30.4
5.6
4.4
21.6
23.5
4.2
3.5
Cadila Healthcare
Reduce
518
450
53,045
9,220
11,584
18.4
20.3
14.5
18.7
35.7
27.7
7.6
6.2
23.5
24.6
6.1
4.6
Cipla
Sell
549
461
44,206
14,281
16,619
15.4
16.2
12.5
19.7
44.0
27.9
3.5
3.2
8.4
12.0
3.3
2.8
Dr Reddy's
Neutral
2,732
-
45,275
14,081
15,937
16.1
18.6
72.6
105.9
37.6
25.8
3.7
3.3
9.6
13.6
3.4
3.0
Dishman Pharma
Sell
143
1,718
1,890
22.7
22.8
9.5
11.3
10.1
10.9
3.3
2.9
GSK Pharma*
Neutral
2,602
-
22,042
2,927
3,290
11.8
16.2
34.4
49.6
75.7
52.5
11.0
11.4
13.9
21.3
7.3
6.6
Indoco Remedies
Sell
196
153
1,809
1,067
1,154
12.1
14.9
8.4
11.3
23.4
17.4
2.8
2.5
12.6
15.0
1.9
1.8
Ipca labs
Buy
474
620
5,984
3,211
3,593
13.9
14.5
15.4
19.4
30.8
24.5
2.4
2.2
8.2
9.5
2.0
1.7
Lupin
Buy
1,150
1,526
51,937
17,120
18,657
24.1
24.1
56.9
61.1
20.2
18.8
3.8
3.2
20.7
18.6
3.3
2.7
Natco Pharma
Accumulate
997
1,060
17,373
2,065
1,988
33.1
33.7
27.9
25.7
35.7
38.8
10.4
8.9
29.2
22.9
8.5
8.6
Sun Pharma
Buy
563
712
135,078
30,264
32,899
29.0
26.9
32.7
31.6
17.2
17.8
3.7
3.1
22.2
18.7
4.2
3.8
Power
Tata Power
Neutral
83
-
22,571
36,916
39,557
17.4
27.1
5.1
6.3
16.4
13.3
1.4
1.3
9.0
10.3
1.6
1.5
NTPC
Neutral
160
-
132,051
86,605
95,545
17.5
20.8
11.8
13.4
13.6
12.0
1.4
1.3
10.5
11.1
2.9
2.9
Power Grid
Accumulate
211
223
110,570
25,315
29,193
88.2
88.7
14.2
17.2
14.9
12.3
2.3
2.0
15.2
16.1
9.0
8.1
Real Estate
Prestige Estate
Neutral
276
-
10,358
4,707
5,105
25.2
26.0
10.3
13.0
26.8
21.3
2.2
2.0
10.3
10.2
3.4
3.0
MLIFE
Buy
437
522
2,242
1,152
1,300
22.7
24.6
29.9
35.8
14.6
12.2
1.1
1.0
7.6
8.6
2.7
2.3
Telecom
Bharti Airtel
Neutral
405
-
162,055
105,086
114,808
34.5
34.7
12.2
16.4
33.2
24.7
2.3
2.1
6.8
8.4
2.5
2.1
Idea Cellular
Neutral
87
-
31,535
40,133
43,731
37.2
37.1
6.4
6.5
13.7
13.5
1.1
1.1
8.2
7.6
1.8
1.5
zOthers
Abbott India
Neutral
4,350
-
9,244
3,153
3,583
14.1
14.4
152.2
182.7
28.6
23.8
140.3
119.9
25.6
26.1
2.6
2.3
Asian Granito
Accumulate
456
480
1,372
1,066
1,169
11.6
12.5
13.0
16.0
35.1
28.6
3.4
3.1
9.5
10.7
1.6
1.4
Bajaj Electricals
Buy
330
395
3,344
4,801
5,351
5.7
6.2
10.4
13.7
31.6
24.1
3.9
3.5
12.4
14.5
0.7
0.6
Banco Products (India)
Neutral
224
-
1,598
1,353
1,471
12.3
12.4
14.5
16.3
15.4
13.7
21.3
19.2
14.5
14.6
1.1
120.6
Coffee Day Enterprises
Neutral
245
-
5,050
2,964
3,260
20.5
21.2
4.7
8.0
-
30.6
2.8
2.6
5.5
8.5
2.1
1.9
Ltd
Competent Automobiles Neutral
190
-
122
1,137
1,256
3.1
2.7
28.0
23.6
6.8
8.1
36.5
33.0
14.3
11.5
0.1
0.1
Elecon Engineering
Neutral
61
-
682
1,482
1,660
13.7
14.5
3.9
5.8
15.6
10.5
3.7
3.4
7.8
10.9
0.8
0.7
Stock Watch
July 11, 2017
Company Name
Reco
CMP
Target
Mkt Cap
Sales ( Čcr )
OPM(%)
EPS (Č)
PER(x)
P/BV(x)
RoE(%)
EV/Sales(x)
(Č)
Price ( Č)
( Č cr )
FY17E
FY18E
FY17E
FY18E
FY17E
FY18E
FY17E
FY18E
FY17E
FY18E
FY17E
FY18E
FY17E
FY18E
zOthers
Finolex Cables
Neutral
491
-
7,515
2,883
3,115
12.0
12.1
14.2
18.6
34.6
26.4
18.4
16.1
15.8
14.6
2.3
2.1
Garware Wall Ropes
Neutral
939
-
2,054
863
928
15.1
15.2
36.4
39.4
25.8
23.8
4.7
4.0
17.5
15.9
2.3
2.1
Goodyear India*
Neutral
911
-
2,102
1,598
1,704
10.4
10.2
49.4
52.6
18.5
17.3
85.2
74.7
18.2
17.0
1.0
143.2
Hitachi
Neutral
2,018
-
5,487
2,081
2,433
8.8
8.9
33.4
39.9
60.4
50.6
48.7
40.6
22.1
21.4
2.6
2.2
HSIL
Neutral
400
-
2,893
2,384
2,515
15.8
16.3
15.3
19.4
26.2
20.6
26.0
22.4
7.8
9.3
1.4
1.3
Interglobe Aviation
Neutral
1,239
-
44,804
21,122
26,005
14.5
27.6
110.7
132.1
11.2
9.4
67.0
47.8
168.5
201.1
2.1
1.7
Jyothy Laboratories
Neutral
366
-
6,643
1,440
2,052
11.5
13.0
8.5
10.0
43.0
36.6
10.4
9.7
18.6
19.3
4.9
3.4
Kirloskar Engines India
Neutral
395
-
5,712
2,554
2,800
9.9
10.0
10.5
12.1
37.6
32.6
15.7
14.9
10.7
11.7
1.9
1.7
Ltd
Linc Pen & Plastics
Neutral
277
-
410
382
420
9.3
9.5
13.5
15.7
20.6
17.6
3.5
3.0
17.1
17.3
1.1
1.0
M M Forgings
Neutral
669
-
807
546
608
20.4
20.7
41.3
48.7
16.2
13.7
91.6
81.1
16.6
17.0
1.3
1.2
Manpasand Bever.
Neutral
768
-
4,391
836
1,087
19.6
19.4
16.9
23.8
45.4
32.2
5.5
4.8
12.0
14.8
5.0
3.8
Mirza International
Neutral
157
-
1,890
963
1,069
17.2
18.0
6.1
7.5
25.6
20.9
3.9
3.3
15.0
15.7
2.2
1.9
MT Educare
Neutral
80
-
318
366
417
17.7
18.2
9.4
10.8
8.5
7.4
1.9
1.6
22.2
22.3
0.8
0.7
Narayana Hrudaya
Neutral
306
-
6,258
1,873
2,166
11.5
11.7
2.6
4.0
115.8
77.2
7.1
6.4
6.1
8.3
3.4
3.0
Navkar Corporation
Buy
206
265
2,931
347
371
43.2
37.3
6.7
6.0
30.8
34.3
2.1
1.9
6.2
10.6
9.6
8.9
Navneet Education
Neutral
177
-
4,136
1,062
1,147
24.0
24.0
6.1
6.6
29.1
26.7
6.0
5.3
20.6
19.8
4.0
3.7
Nilkamal
Neutral
1,947
-
2,905
1,995
2,165
10.7
10.4
69.8
80.6
27.9
24.2
111.3
96.6
16.6
16.5
1.5
1.3
Page Industries
Neutral
16,684
-
18,610
2,450
3,124
20.1
17.6
299.0
310.0
55.8
53.8
371.6
283.7
47.1
87.5
7.6
6.0
Parag Milk Foods
Neutral
232
-
1,947
1,919
2,231
9.3
9.6
9.5
12.9
24.5
17.9
3.8
3.1
15.5
17.5
1.2
1.0
Quick Heal
Neutral
220
-
1,541
408
495
27.3
27.0
7.7
8.8
28.4
25.0
2.6
2.6
9.3
10.6
2.9
2.4
Radico Khaitan
Accumulate
136
147
1,813
1,667
1,824
13.0
13.2
6.7
8.2
20.5
16.7
1.9
1.7
9.0
10.2
1.5
1.3
Relaxo Footwears
Neutral
512
-
6,154
2,085
2,469
9.2
8.2
7.6
8.0
67.8
64.5
26.3
22.4
17.9
18.8
3.0
2.6
S H Kelkar & Co.
Neutral
260
-
3,765
1,036
1,160
15.1
15.0
6.1
7.2
42.6
36.3
4.6
4.2
10.7
11.5
3.5
3.1
Siyaram Silk Mills
Accumulate
2,245
2,500
2,105
1,574
1,769
12.5
12.7
97.1
113.1
23.1
19.9
3.6
3.1
15.4
15.5
1.5
1.4
Styrolution ABS India*
Neutral
947
-
1,665
1,440
1,537
9.2
9.0
40.6
42.6
23.3
22.2
59.5
54.1
12.3
11.6
1.1
1.0
Surya Roshni
Neutral
288
-
1,264
3,342
3,625
7.8
7.5
17.3
19.8
16.7
14.6
31.7
25.4
10.5
10.8
0.6
0.6
Team Lease Serv.
Neutral
1,470
-
2,513
3,229
4,001
1.5
1.8
22.8
32.8
64.6
44.8
6.9
6.0
10.7
13.4
0.7
0.5
The Byke Hospitality
Neutral
191
-
766
287
384
20.5
20.5
7.6
10.7
25.1
17.9
5.3
4.2
20.7
23.5
2.7
2.0
Transport Corporation of
Neutral
337
-
2,584
2,671
2,911
8.5
8.8
13.9
15.7
24.4
21.6
3.3
3.0
13.7
13.8
1.1
1.0
India
Stock Watch
July 11, 2017
Company Name
Reco
CMP
Target Mkt Cap
Sales ( Čcr )
OPM(%)
EPS (Č)
PER(x)
P/BV(x)
RoE(%)
EV/Sales(x)
(Č)
Price ( Č)
( Č cr )
FY17E FY18E FY17E FY18E FY17E FY18E FY17E FY18E FY17E FY18E FY17E FY18E FY17E FY18E
zOthers
TVS Srichakra
Neutral
3,877
-
2,968
2,304
2,614
13.7
13.8
231.1
266.6
16.8
14.5
435.6
343.0
33.9
29.3
1.3
1.1
UFO Moviez
Neutral
385
-
1,063
619
685
33.2
33.4
30.0
34.9
12.9
11.0
1.8
1.5
13.8
13.9
1.4
1.1
Visaka Industries
Neutral
539
-
856
1,051
1,138
10.3
10.4
21.0
23.1
25.7
23.3
69.1
64.7
9.0
9.2
1.1
1.0
VRL Logistics
Neutral
336
-
3,066
1,902
2,119
16.7
16.6
14.6
16.8
23.1
20.0
5.1
4.4
21.9
22.2
1.7
1.5
VIP Industries
Buy
190
218
2,678
1,270
1,450
10.4
10.4
5.6
6.5
33.8
29.2
7.0
6.1
20.7
21.1
2.1
1.8
Navin Fluorine
Buy
3,057
3,650
3,009
789
945
21.1
22.4
120.1
143.4
25.5
21.3
4.1
3.5
17.8
18.5
3.7
3.1
Source: Company, Angel Research; Note: *December year end; #September year end; &October year end; Price as on July 10, 2017
Market Outlook
July 11, 2017
Research Team Tel: 022 - 39357800
DISCLAIMER
Angel Broking Private Limited (hereinafter referred to as “Angel”) is a registered Member of National Stock Exchange of India
Limited,Bombay Stock Exchange Limited and Metropolitan Stock Exchange Limited. It is also registered as a Depository Participant with
CDSL and Portfolio Manager with SEBI. It also has registration with AMFI as a Mutual Fund Distributor. Angel Broking Private Limited is a
registered entity with SEBI for Research Analyst in terms of SEBI (Research Analyst) Regulations, 2014 vide registration number
INH000000164. Angel or its associates has not been debarred/ suspended by SEBI or any other regulatory authority for accessing
/dealing in securities Market. Angel or its associates/analyst has not received any compensation / managed or
co-managed public offering of securities of the company covered by Analyst during the past twelve months.
This document is solely for the personal information of the recipient, and must not be singularly used as the basis of any investment
decision. Nothing in this document should be construed as investment or financial advice. Each recipient of this document should make
such investigations as they deem necessary to arrive at an independent evaluation of an investment in the securities of the companies
referred to in this document (including the merits and risks involved), and should consult their own advisors to determine the merits and
risks of such an investment.
Reports based on technical and derivative analysis center on studying charts of a stock's price movement, outstanding positions and
trading volume, as opposed to focusing on a company's fundamentals and, as such, may not match with a report on a company's
fundamentals. Investors are advised to refer the Fundamental and Technical Research Reports available on our website to evaluate the
contrary view, if any.
The information in this document has been printed on the basis of publicly available information, internal data and other reliable
sources believed to be true, but we do not represent that it is accurate or complete and it should not be relied on as such, as this
document is for general guidance only. Angel Broking Pvt. Limited or any of its affiliates/ group companies shall not be in any way
responsible for any loss or damage that may arise to any person from any inadvertent error in the information contained in this report.
Angel Broking Pvt. Limited has not independently verified all the information contained within this document. Accordingly, we cannot
testify, nor make any representation or warranty, express or implied, to the accuracy, contents or data contained within this document.
While Angel Broking Pvt. Limited endeavors to update on a reasonable basis the information discussed in this material, there may be
regulatory, compliance, or other reasons that prevent us from doing so.
This document is being supplied to you solely for your information, and its contents, information or data may not be reproduced,
redistributed or passed on, directly or indirectly.
Neither Angel Broking Pvt. Limited, nor its directors, employees or affiliates shall be liable for any loss or damage that may arise from
or in connection with the use of this information.